
Study finds vegetation greener inside 21 GW Chinese solar cluster
Researchers at Hohai University used satellite data to analyze vegetation changes at the Gonghe Talatan solar cluster in Qinghai province. The study reports that vegetation indices were higher within the plant sites compared to adjacent areas and pre-construction levels.
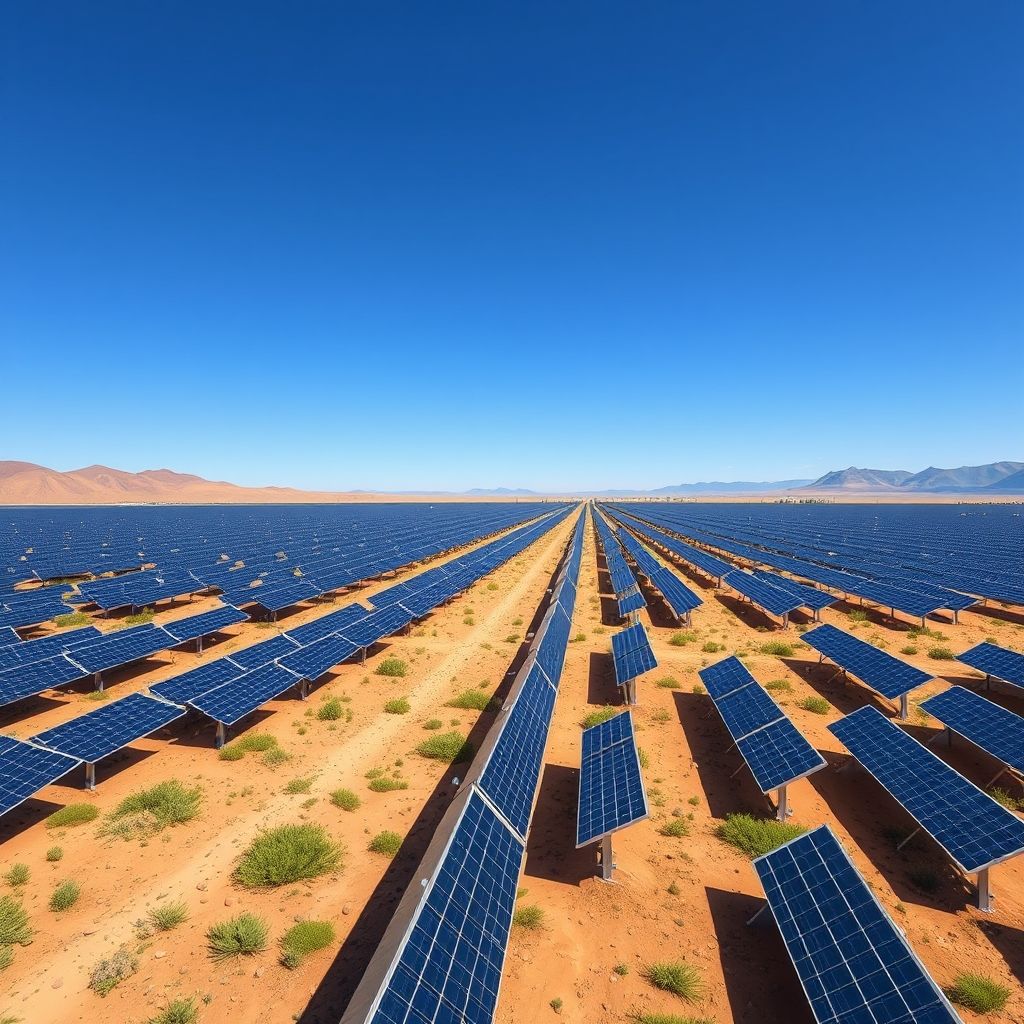
Researchers at Hohai University have reported that vegetation inside the 21 GW Gonghe Talatan solar cluster exhibits higher greenness than surrounding areas. The study, conducted in Gonghe County within Hainan Tibetan Autonomous Prefecture in Qinghai province, China, measured vegetation health using the Normalized Difference Vegetation Index (NDVI).
According to the findings, the average NDVI within the solar plants was 11.5% higher than in adjacent control areas.
Methodology and Site Context
The Gonghe Talatan cluster sits on flat terrain at an average elevation of approximately 2,920 meters. The local climate is cold and arid to semi-arid, with an average annual temperature of 4.1 C. Water balance in this region is heavily skewed toward loss; annual precipitation totals 303 mm, while evaporation reaches approximately 1,800 mm. Despite the dryness, the site enjoys over 2,900 hours of sunshine annually.
To assess vegetation health, the researchers analyzed 158 photovoltaic plant sites in a 2025 study. The methodology relied on two distinct satellite sources to capture data at different scales. They used Beijing-3 imagery with a 1.2-meter resolution to examine fine-grained details, alongside Landsat imagery with a 30-meter resolution for broader coverage. Combining these datasets allowed the team to evaluate the Normalized Difference Vegetation Index across the extensive solar infrastructure within this high-altitude environment.
Satellite Findings
Published in Information Geography under the title “Impacts of large-scale centralized photovoltaic plant construction on vegetation: Satellite evidence from Gonghe photovoltaic park, China,” the study details how vegetation metrics shifted after installation. Landsat data from 2024 to 2026 revealed that NDVI differences between solar sites and control areas varied across 12 monthly comparisons, ranging from 3.5% to 10.7%.
In the second year after construction, NDVI levels exceeded pre-construction baselines by 19.9%. Between the second and fifth years, the average increase reached 28.4%. For plants completed between 2013 and 2018, the data recorded NDVI increases ranging from 14.1% to 35.9%, demonstrating consistent positive shifts across different installation vintages.
| Metric | Value |
|---|---|
| Monthly NDVI difference (2024–2026) | 3.5% – 10.7% |
| NDVI increase in year two | 19.9% above pre-construction |
| Average NDVI increase (years 2–5) | 28.4% |
| NDVI increase (plants completed 2013–2018) | 14.1% – 35.9% |
Drivers and Limitations
- Analysts observed that NDVI values inside PV plant boundaries tended to be marginally elevated compared to the adjacent exterior regions.
- This disparity was most evident in the southern PV plant zones, which displayed noticeably greater vegetation greenness than other PV plant sections.
- Possible factors contributing to this enhanced vegetation include shade from panels, diminished evaporation, decreased wind velocities, and the redistribution of precipitation.
- Additional water inputs from panel washing and vegetation reseeding were also pinpointed as likely contributors, despite the absence of direct verification for these mechanisms.
- The research admits constraints such as climate fluctuations, inaccuracies in satellite data, and the absence of ground-based measurements.
Regional Climate and Prior Ecological Assessments
The study region’s hydrology is defined by a stark imbalance: 303 mm of annual precipitation contrasts with 1,800 mm of evaporation, with 88% of rainfall concentrated between May and September. The area also experiences significant wind-driven sand movement. In October 2024, scientists at China’s Xi’an University of Technology examined a 1 GW installation within the park, reporting that it achieved a higher environmental assessment score than surrounding areas, indicating improvements in local microclimate, soil properties, and plant and microbial diversity. More recently, researchers at the Chinese Academy of Sciences evaluated cooling effects from eight solar plants across China’s arid regions. Their analysis found that PV installations create localized cooling extending 120 to 540 meters beyond boundaries, with intensity reaching 3.1 C in some locations. Vegetation responses in that study varied by season, geography, and plant design, underscoring the site-dependent nature of ecological benefits from large-scale solar development.
Source: pv magazine. This article is an original Luminity report based on the linked source.