
Six-year study links reduced maintenance to PV plant efficiency drop
A six-year operational study of a 12 MW solar plant in Algeria found that performance ratios fell during 2020, a period coinciding with reduced maintenance activities due to the pandemic. The research, conducted at Djillali Liabes University, documents how operational disruptions impacted yield over a five-year span.
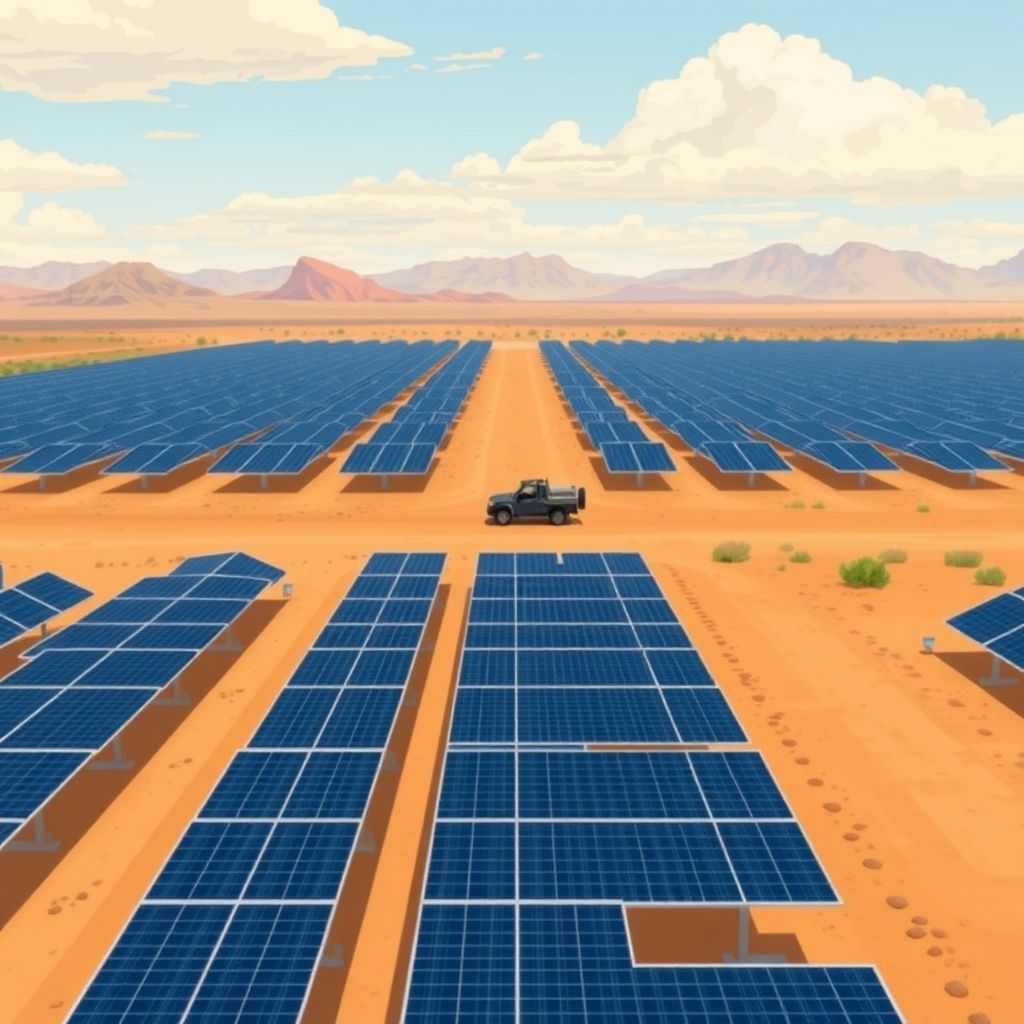
A six-year field study conducted by researchers at Djillali Liabes University of Sidi Bel-Abbes has examined the operational performance of a 12 MW grid-connected solar plant in Algeria. The investigation tracked the facility’s output from 2018 through 2023, focusing on how maintenance intervals influence overall system efficiency over time.
The findings, reported by pv magazine, suggest a link between reduced maintenance frequency and a decline in plant efficiency. While the data covers a substantial period and a significant installation size, the study highlights the importance of regular upkeep in preserving long-term energy yield. These results offer practical insights for operators managing large-scale photovoltaic assets in similar climatic conditions.
Operational Configuration
- 47,808 Hanwha Qcells 250 W polycrystalline modules
- SMA Sunny Central 800CP XT inverters
- Six 2 MW subfields, each with two inverters and one transformer
- Semi-automatic cleaning via tractor-towed rotating brushes
- Data logged every 15 minutes per IEC 61724 standards
The physical layout of the facility relies on a standardized grid of polycrystalline modules paired with central inverter technology. This specific hardware combination is common in large-scale installations where centralized power conversion simplifies electrical architecture. Polycrystalline cells, while slightly less efficient than monocrystalline alternatives, remain widely deployed due to established manufacturing processes and cost structures. The use of central inverters means that electrical output from multiple string connections is aggregated before conversion, a design choice that influences how maintenance issues might propagate through the system.
Operational monitoring for the study followed rigorous international protocols, with data captured at fifteen-minute intervals in accordance with IEC 61724 guidelines. This high-resolution logging allows for detailed analysis of performance ratios and loss mechanisms over time. Physical maintenance was handled by a semi-automatic cleaning system that employs tractor-towed rotating brushes to remove dust and debris from the module surfaces. Such automated cleaning methods are increasingly adopted in arid regions to manage soiling losses without relying entirely on manual labor. The division of the plant into six distinct subfields, each equipped with dedicated inverters and a transformer, creates modular units that can be analyzed independently, helping researchers isolate the impact of specific maintenance intervals on overall yield.
Yield Fluctuations and Maintenance Impact
The six-year dataset reveals distinct variations in energy production, with annual electricity output ranging from 19.83 to 21.41 GWh. Monthly figures also fluctuated significantly, peaking at 2,258 MWh in August 2019 and bottoming out at 1,125 MWh in January 2020. These seasonal extremes reflect natural irradiance patterns, but the study isolates a specific anomaly in 2020 linked to reduced maintenance activities during the pandemic. The researchers note that this period saw a noticeable drop in yield, which they attribute to the interruption of routine cleaning and inspection schedules.
"This drop in yield underscores the crucial role of regular maintenance," the authors state. In large-scale photovoltaic plants, dust accumulation on module surfaces can significantly reduce light transmission, directly lowering power conversion efficiency. While automated cleaning systems, such as the tractor-towered brushes used at this site, mitigate soiling losses, their effectiveness depends on consistent operational deployment. When maintenance intervals stretch beyond optimal periods, particularly in arid environments where dust settles quickly, the cumulative impact on output can become substantial. This correlation highlights how operational logistics, not just hardware quality, dictate long-term performance.
For operators, these findings emphasize that maintenance is not merely a compliance requirement but a primary driver of energy yield. The 2020 data suggests that even temporary disruptions to upkeep routines can have measurable effects on annual generation. As solar assets age, the interplay between environmental soiling and service frequency becomes increasingly critical for maintaining expected return on investment. The study’s emphasis on this link provides a clear benchmark for planning maintenance cycles in similar climatic conditions.
Efficiency Metrics
The study quantifies system health through the performance ratio, a metric that compares actual output to theoretical maximums based on solar irradiance. This figure isolates losses from environmental and technical factors, providing a standardized benchmark for operators. The following table summarizes the key efficiency indicators recorded over the six-year period.
| Metric | Value |
|---|---|
| Performance Ratio (2019) | 85.37% |
| Performance Ratio (2020) | 78.74% |
| Performance Ratio (2023) | 84.83% |
| Six-year Average PR | 82.6% |
| Inverter Efficiency | 97–98% |
| Module Efficiency | 12% to 14% |
| Avg. Annual Capacity Factor | 19.3% |
The 2020 performance ratio dipped to 78.74% before recovering to 84.83% by 2023, mirroring the maintenance interruptions described earlier. The six-year average of 82.6% sits comfortably within the typical range for utility-scale plants in arid regions, where high irradiance often offsets moderate soiling losses. Inverter efficiency, held steady at 97–98%, indicates that power electronics contributed minimally to the observed yield variations. Module efficiency, ranging from 12% to 14%, reflects the inherent conversion limits of the polycrystalline technology used. The average annual capacity factor of 19.3% provides context for the plant’s contribution to the grid, translating the raw generation figures into a standardized measure of utilization. For investors, these metrics confirm that while hardware performance remained consistent, operational variables like cleaning frequency drove the short-term efficiency fluctuations.
What to watch
The most immediate question for asset managers is how to calibrate maintenance schedules against these specific degradation benchmarks. The study estimates annual degradation rates of 4.12% and 4.38%, figures that sit notably higher than the industry norm for well-maintained utility-scale installations. For investors evaluating long-term cash flow, such elevated decay rates directly compress the operational lifespan of the asset, potentially altering the internal rate of return calculations used in original financial models.
Future monitoring should focus on whether the performance ratio stabilizes once routine cleaning resumes fully. The 2023 recovery suggests resilience, but the persistent gap between the six-year average and peak years indicates lingering inefficiencies. Operators in similar arid climates should scrutinize their own maintenance logs for comparable dips, as the correlation between service interruptions and yield loss appears robust in this dataset.
Regulators and grid operators may also examine these findings when setting performance guarantees for new tenders. If reduced maintenance consistently accelerates degradation beyond standard warranties, contract structures might evolve to penalize missed service windows more strictly. Developers should prepare for tighter compliance requirements, where automated cleaning logs become a mandatory component of performance reporting rather than an optional operational detail.
Source: pv magazine. This article is an original Luminity report based on the linked source.