
CREA: Renewables pass coal in capacity, but coal drove 73% of summer output growth
CREA reports that renewable capacity reached 243 GW, overtaking coal and lignite at 231 GW, while coal still supplied 66% of total electricity generation. The report highlights a widening gap between coal consumption and supply, noting that coal did not keep pace with high summer demand.
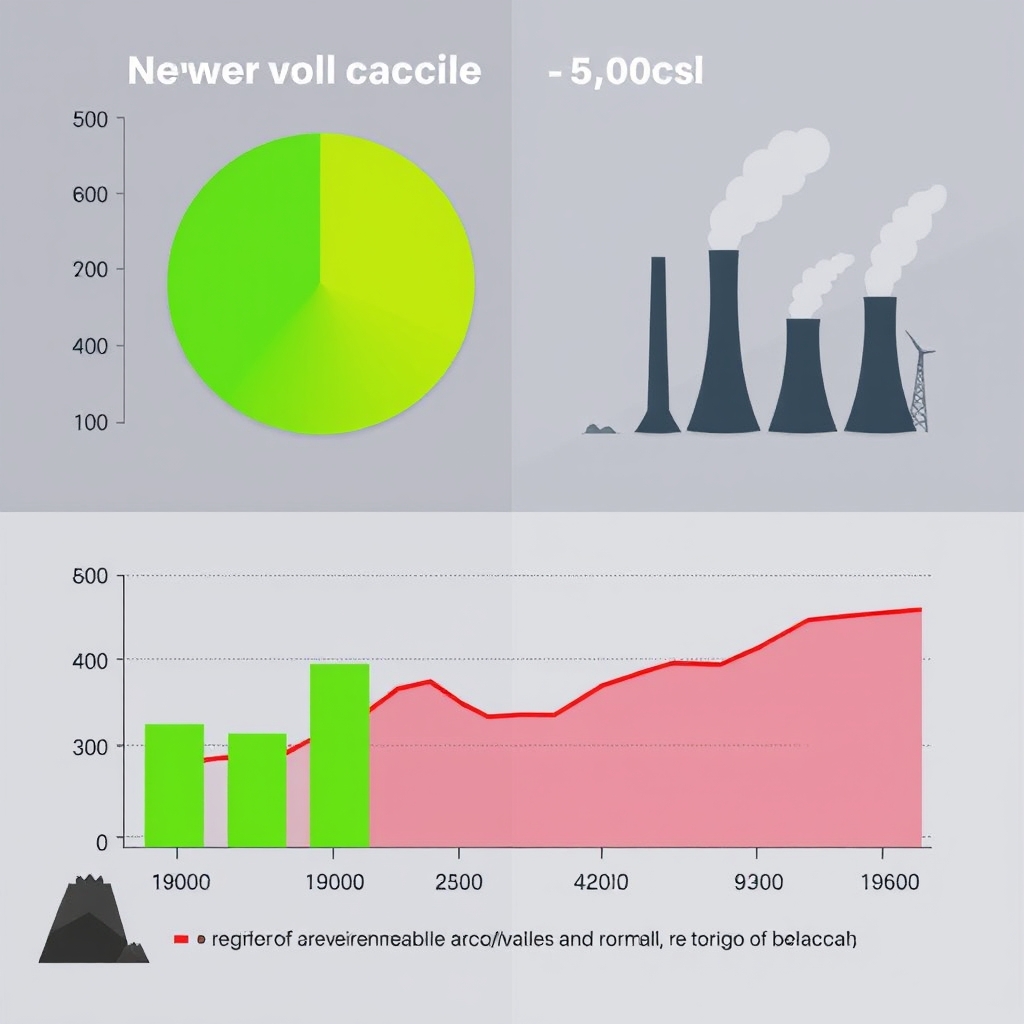
CREA reports that renewables now account for 243 GW, or 44% of total installed capacity, while coal and lignite stand at 231 GW, representing 42%.
According to CREA, coal and lignite units produced 351 billion units, which constitutes 66% of total output.
Capacity vs Generation
The shift in India’s power mix is evident when comparing current figures with those from a year earlier. CREA data shows renewables’ share of installed capacity rising to 44% from 39%, while coal and lignite capacity declined to 42% from a previous 45%. Total installed capacity reached 555 GW in August, marking a 12% year-on-year increase. Solar power dominates the renewable segment, contributing 168 GW or 30% of the total mix.
Renewables generated 101 billion units, accounting for 19% of total output. CREA recorded 1,835 million units of solar and wind curtailment between July and August, indicating periods where available renewable energy was not utilized. Battery storage capacity available for night peak supply increased to 5.5 GW from 4.1 GW in the previous quarter, though this remains a small fraction of the total load.
Summer Output Dynamics
CREA data reveals that total electricity generation rose 11% year-on-year to 536 billion units. While renewables expanded, coal and lignite accounted for 73% of this summer output growth. The following table compares the year-on-year growth rates of key generation sources:
| Source | Year-on-Year Growth |
|---|---|
| Solar | 39% |
| Wind | 29% |
| Nuclear | 26% |
Non-fossil sources collectively generated a record 177 billion units. Solar contributed 27% of the total year-on-year output increase, while wind added 19%.
Utilization Metrics
Large hydro generation fell 20% year on year, with its plant load factor dropping to 50% from 61% a year earlier. Solar utilisation factors stood at 18.3%, slightly below the previous year’s level.
Peak demand reached 270 GW on July 16, an 18% increase from 230 GW the prior year.
Coal Supply Strain
- CREA records monthly coal usage of 79 million tonnes from June through September.
- Deliveries to power stations decreased to 66 million tonnes in August, compared to 74 million tonnes in May.
- Inventory levels reached 21 million tonnes by September 30, significantly under the standard benchmark of 58 million tonnes.
- The count of facilities with stock below 25% of necessary levels increased to 85 on October 1, up from 32 on August 22.
- According to CREA, "coal supply did not keep pace with this high level of consumption," highlighting "growing pressure on the coal supply chain."
Operational Records and Grid Constraints
CREA notes that renewable output, excluding large hydro, surpassed 100 billion units for the first time, with solar hitting a daily high of 705 million units on September 30. The report identifies 9.1 gigawatt-hours of operational battery capacity, which supplied up to 5.5 GW at the night peak. Despite solar hours reducing daily peaks on 62 of the quarter’s 92 days, the evening peak remains largely met by coal. CREA attributes the divergence between capacity and generation shares to the intermittent nature of solar and wind, which generate only when weather conditions permit.
Source: ETEnergyWorld Renewables. This article is an original Luminity report based on the linked source.